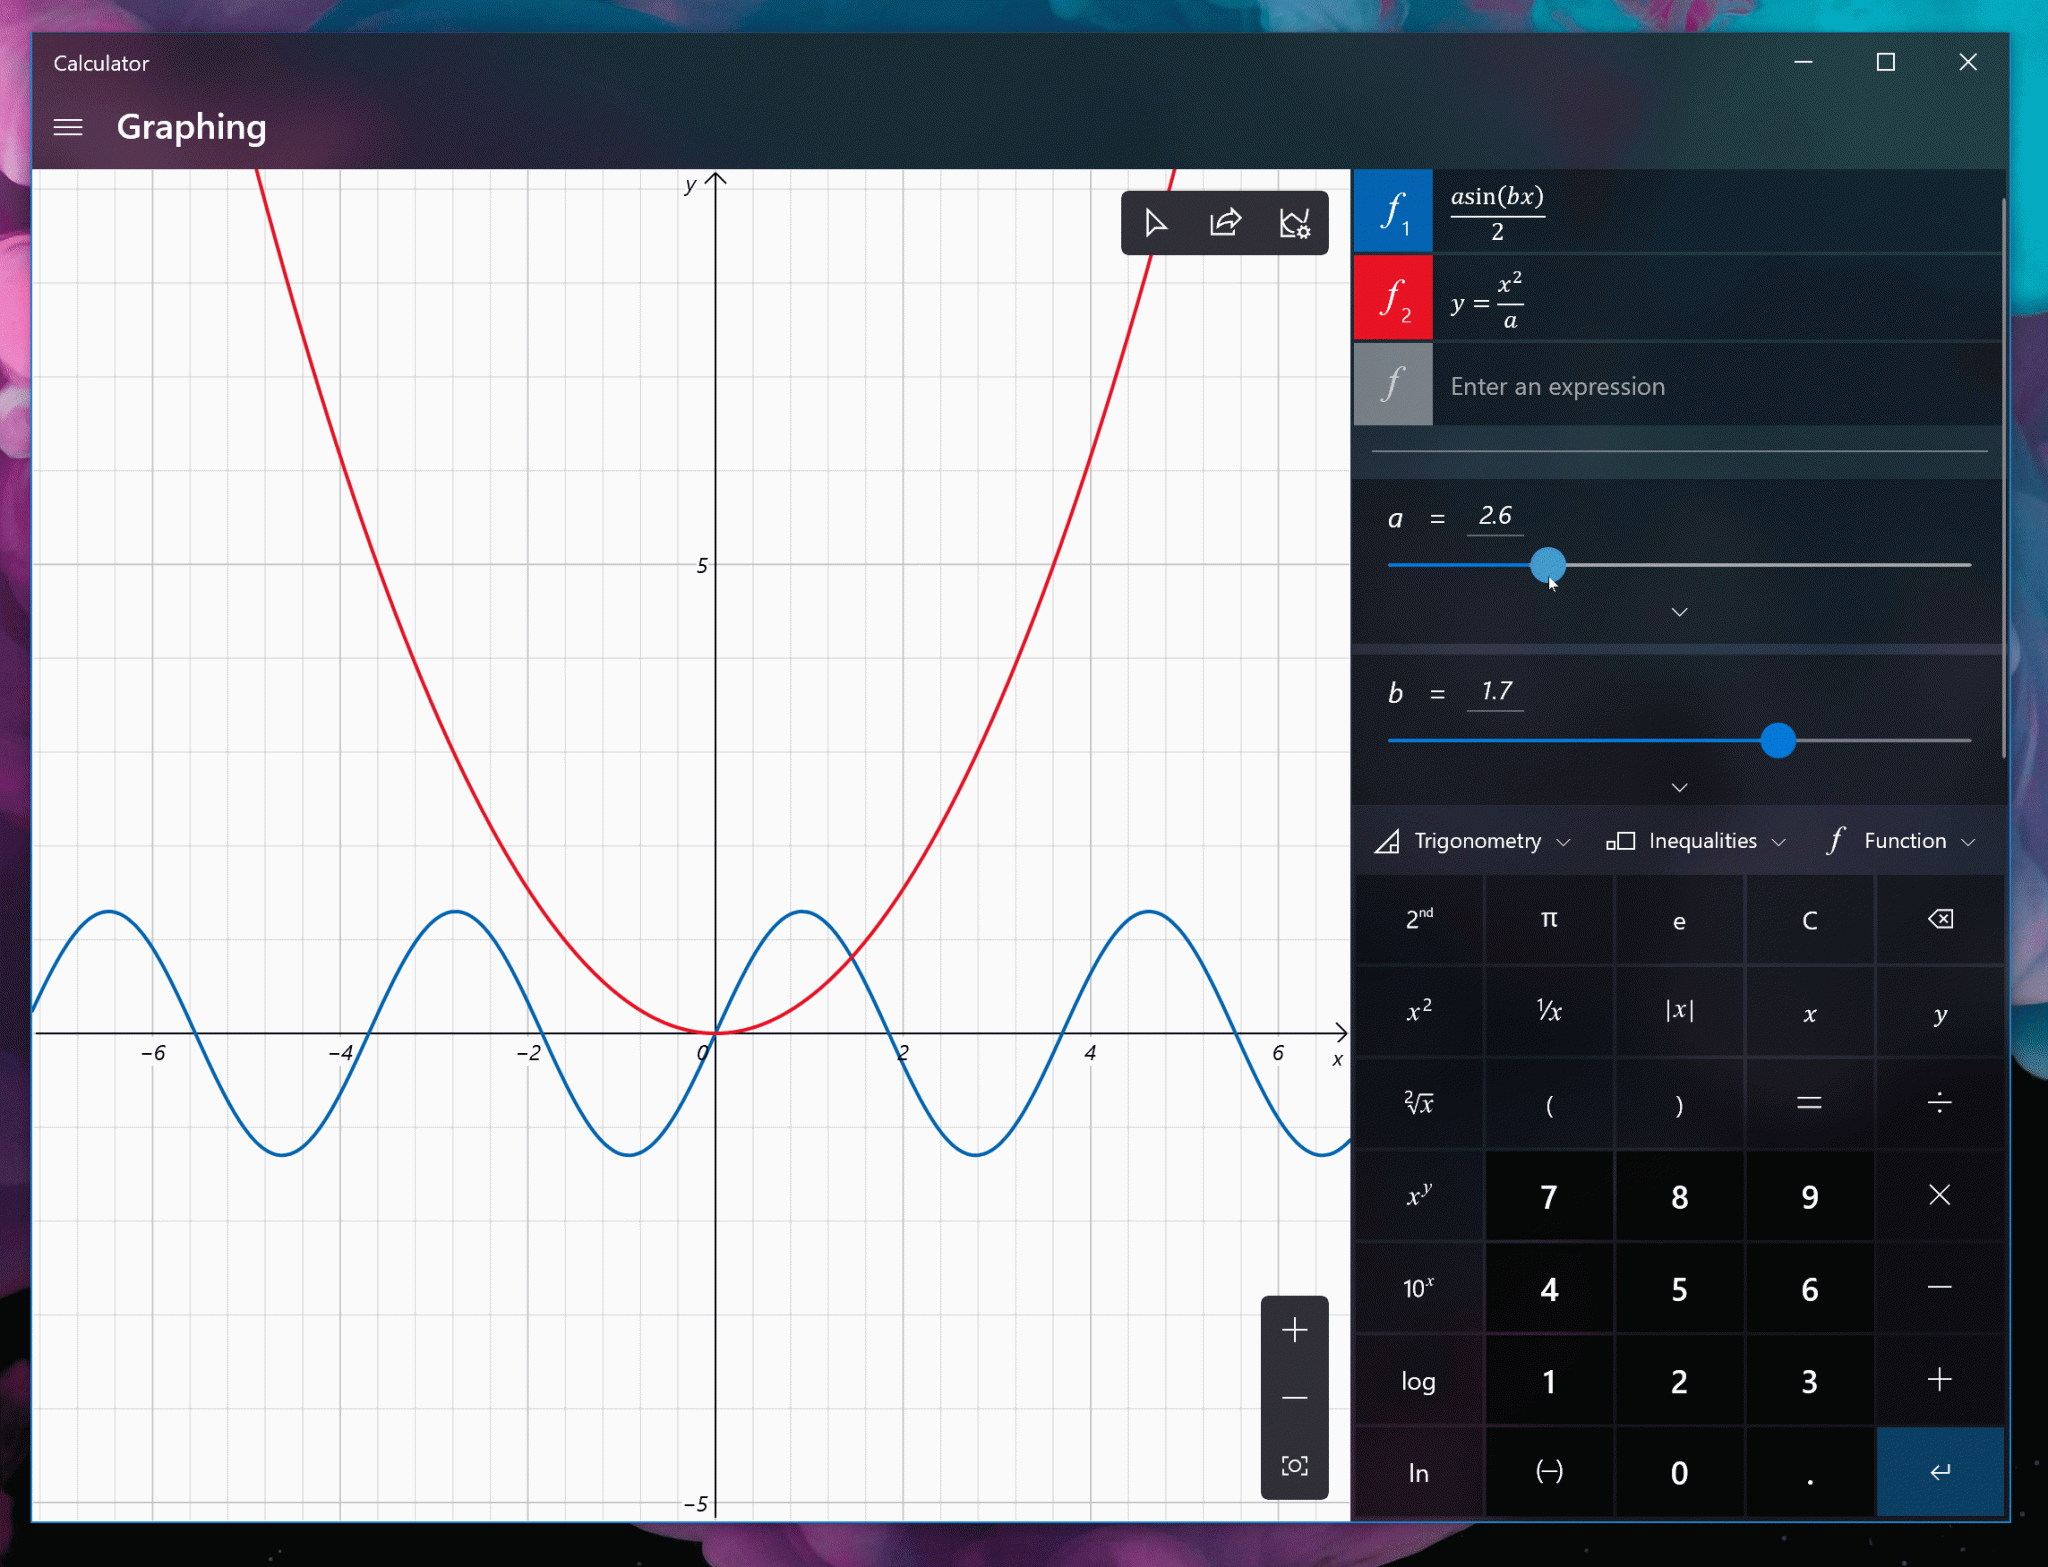
Microsoft releases Windows Calculator graphing mode feature
In the previous report, we have mentioned the Microsoft open-source calculator application and are still actively accepting user feedback including graphics drawing functions that support functions.
After the efforts of the development team, the function has been tested and provided to all users, and now the official version users can also get the graphics drawing function myself.
Supported functions include trigonometric functions, linear algebra, equations, etc. Students can enter expressions and then view graph changes and can scroll to switch.
Users using Windows 10 Build 15063 please click here to enter the Micorosft Store to download the calculator application.
Key features
- Plot one or more equations on the graph. Enter multiple equations so that you can compare plots against each other and see interactions between the lines.
- Add equations with variables. If you enter equations with variables (e.g., y = mx + b), you’ll be able to update the value of those variables to see the changes live on the graph.
- Analyze the graph. Trace plots with your mouse or keyboard and analyze equations to help identify key graph features, like the x- and y-intercepts.


