
Digital forensics is an important part of cybersecurity defensive efforts, but is much more than that. Nowadays it is used in the investigation of almost every major crime, to uncover digital evidence that can assist in legal proceedings.
While there are many tools and techniques used in digital forensics, one ubiquitous tool is Wireshark. It provides forensic information on the critical network layer, allowing security professionals to capture and analyze suspicious network traffic. I’ll introduce the Wireshark platform and show how to perform a basic forensic analysis of network data.
What Is Wireshark?
Wireshark is an open source network protocol analyzer that captures and analyzes signals and data traffic across various communication networks. It helps detect network issues, define software and communications protocols, and analyze and resolve errors.
Here are key capabilities of Wireshark:
- Data filtering
- Network monitoring
- SSL security
- Analytics
- Data visualization
- Automated notifications
It also allows reading live data from ethernet, token rings, USBs, and more. TShark, a terminal-based version of Wireshark, can collect packet data from a live network, store this data in a centralized repository, and analyze network packets from existing files.
Key Wireshark Features and Use Cases
Wireshark is a packet analysis tool that provides information about network security and helps troubleshoot network issues. This tool supports many scenarios, including government agencies, corporations, educational institutions, nonprofits, and small businesses. It also works well as a learning tool.
Wireshark offers various features. It can capture live network traffic data and store the information for offline analysis. Wireshark can capture files created by tcpdump/WinDump for analysis, and import and analyze hex dumps of packet data. It offers in-depth insight into packet data, and can export packets or a filtered subset to various capture file formats.
Here are key Wireshark use cases:
- Analyze—Wireshark analyzes bandwidth usage and provides insights.
- Identify—Wireshark provides features to help identify the cause of unauthorized data exfiltration and slow Internet connectivity.
- Investigate—Wireshark tracks information and performs analysis to help investigate lost data packets.
- Troubleshoot—Wireshark can help teams troubleshoot latency issues.
- Detect—teams can employ Wireshark to detect malicious network activity across the network.
- Trace—teams can use Wireshark to trace voice over Internet (VoIP) calls over the network.
- Intercept—Wireshark can help intercept man-in-the-Middle (MITM) attacks.
Wireshark renders and translates traffic into readable formats, eliminating the need for manual translation of binary information. It works in real-time to ensure teams can rapidly address detected before they escalate into a service outage or a security breach.
Using Wireshark Data for Forensic Analysis and Incident Response
Wireshark can capture network traffic data, offering valuable traffic dissection capabilities to improve incident response. Wireshark’s creators emphasized an intuitive UI with built-in viewing and analysis functionality.
Most web-based and malware-based attacks exploit the network, so network traffic analysis is essential for addressing threats. Here are some of Wiresharks’ basic capabilities for incident response use cases:
- High-level awareness—Wireshark provides high-level awareness of various live and packet capture-based traffic types. It offers visual cues for abnormal packets (e.g., coloring RST packets red for visibility). Users can scroll through packet summaries to view the overall traffic mix in a capture, drawing attention to abnormalities for further investigation.
- Statistical data—Wireshark provides rich high-level statistical data for packet captures. Users can view statistics via a Dropbox menu in the Wireshark menu, helping them identify abnormal network connection patterns.
- Detailed filtering—Wireshark provides high-level filters to help simplify the management of large packet captures. Filters can help identify packets of interest and bypass the white noise. Wireshark’s filters include protocol- and field-based filtering, and users can combine them with Boolean logic. For example, the HTTP filter helps identify issues with packets using HTTP, while a field filter might help identify domain-specific traffic based on certain field values.
Digital Forensics with Wireshark
Installation
Wireshark can run on Windows, Linux, or Mac.
Installing Wireshark on Windows
Windows users can download the Wireshark version compatible with their operating system version. For example, a Windows 10 user should open the 64-bit Windows installer and go through the installation wizard. Administrator privileges are required to install on Windows.
Installing Wireshark on Linux
Linux users can use the following sequence to install Wireshark on their system:
$ sudo apt-get install wireshark
$ sudo dpkg-reconfigure wireshark-common
$ sudo usermod -a -G wireshark $USER
$ newgrp wireshark
This procedure requires root privileges. After completing these steps, users should log out and log in again to launch Wireshark.
Installing Wireshark on Mac
Mac users can install Wireshark using Homebrew. The first step is to install Homebrew by running the following command at the Terminal prompt:
/usr/bin/ruby -e “$(curl -fsSL https://raw.githubusercontent.com/Homebrew/install/master/install)”
After installing the Homebrew system, users can access various Mac-compatible open source projects. The following Terminal command will install Wireshark:
brew install wireshark
Homebrew responds by downloading and installing Wireshark and the relevant dependencies to ensure it runs correctly.
Data Packet Analysis
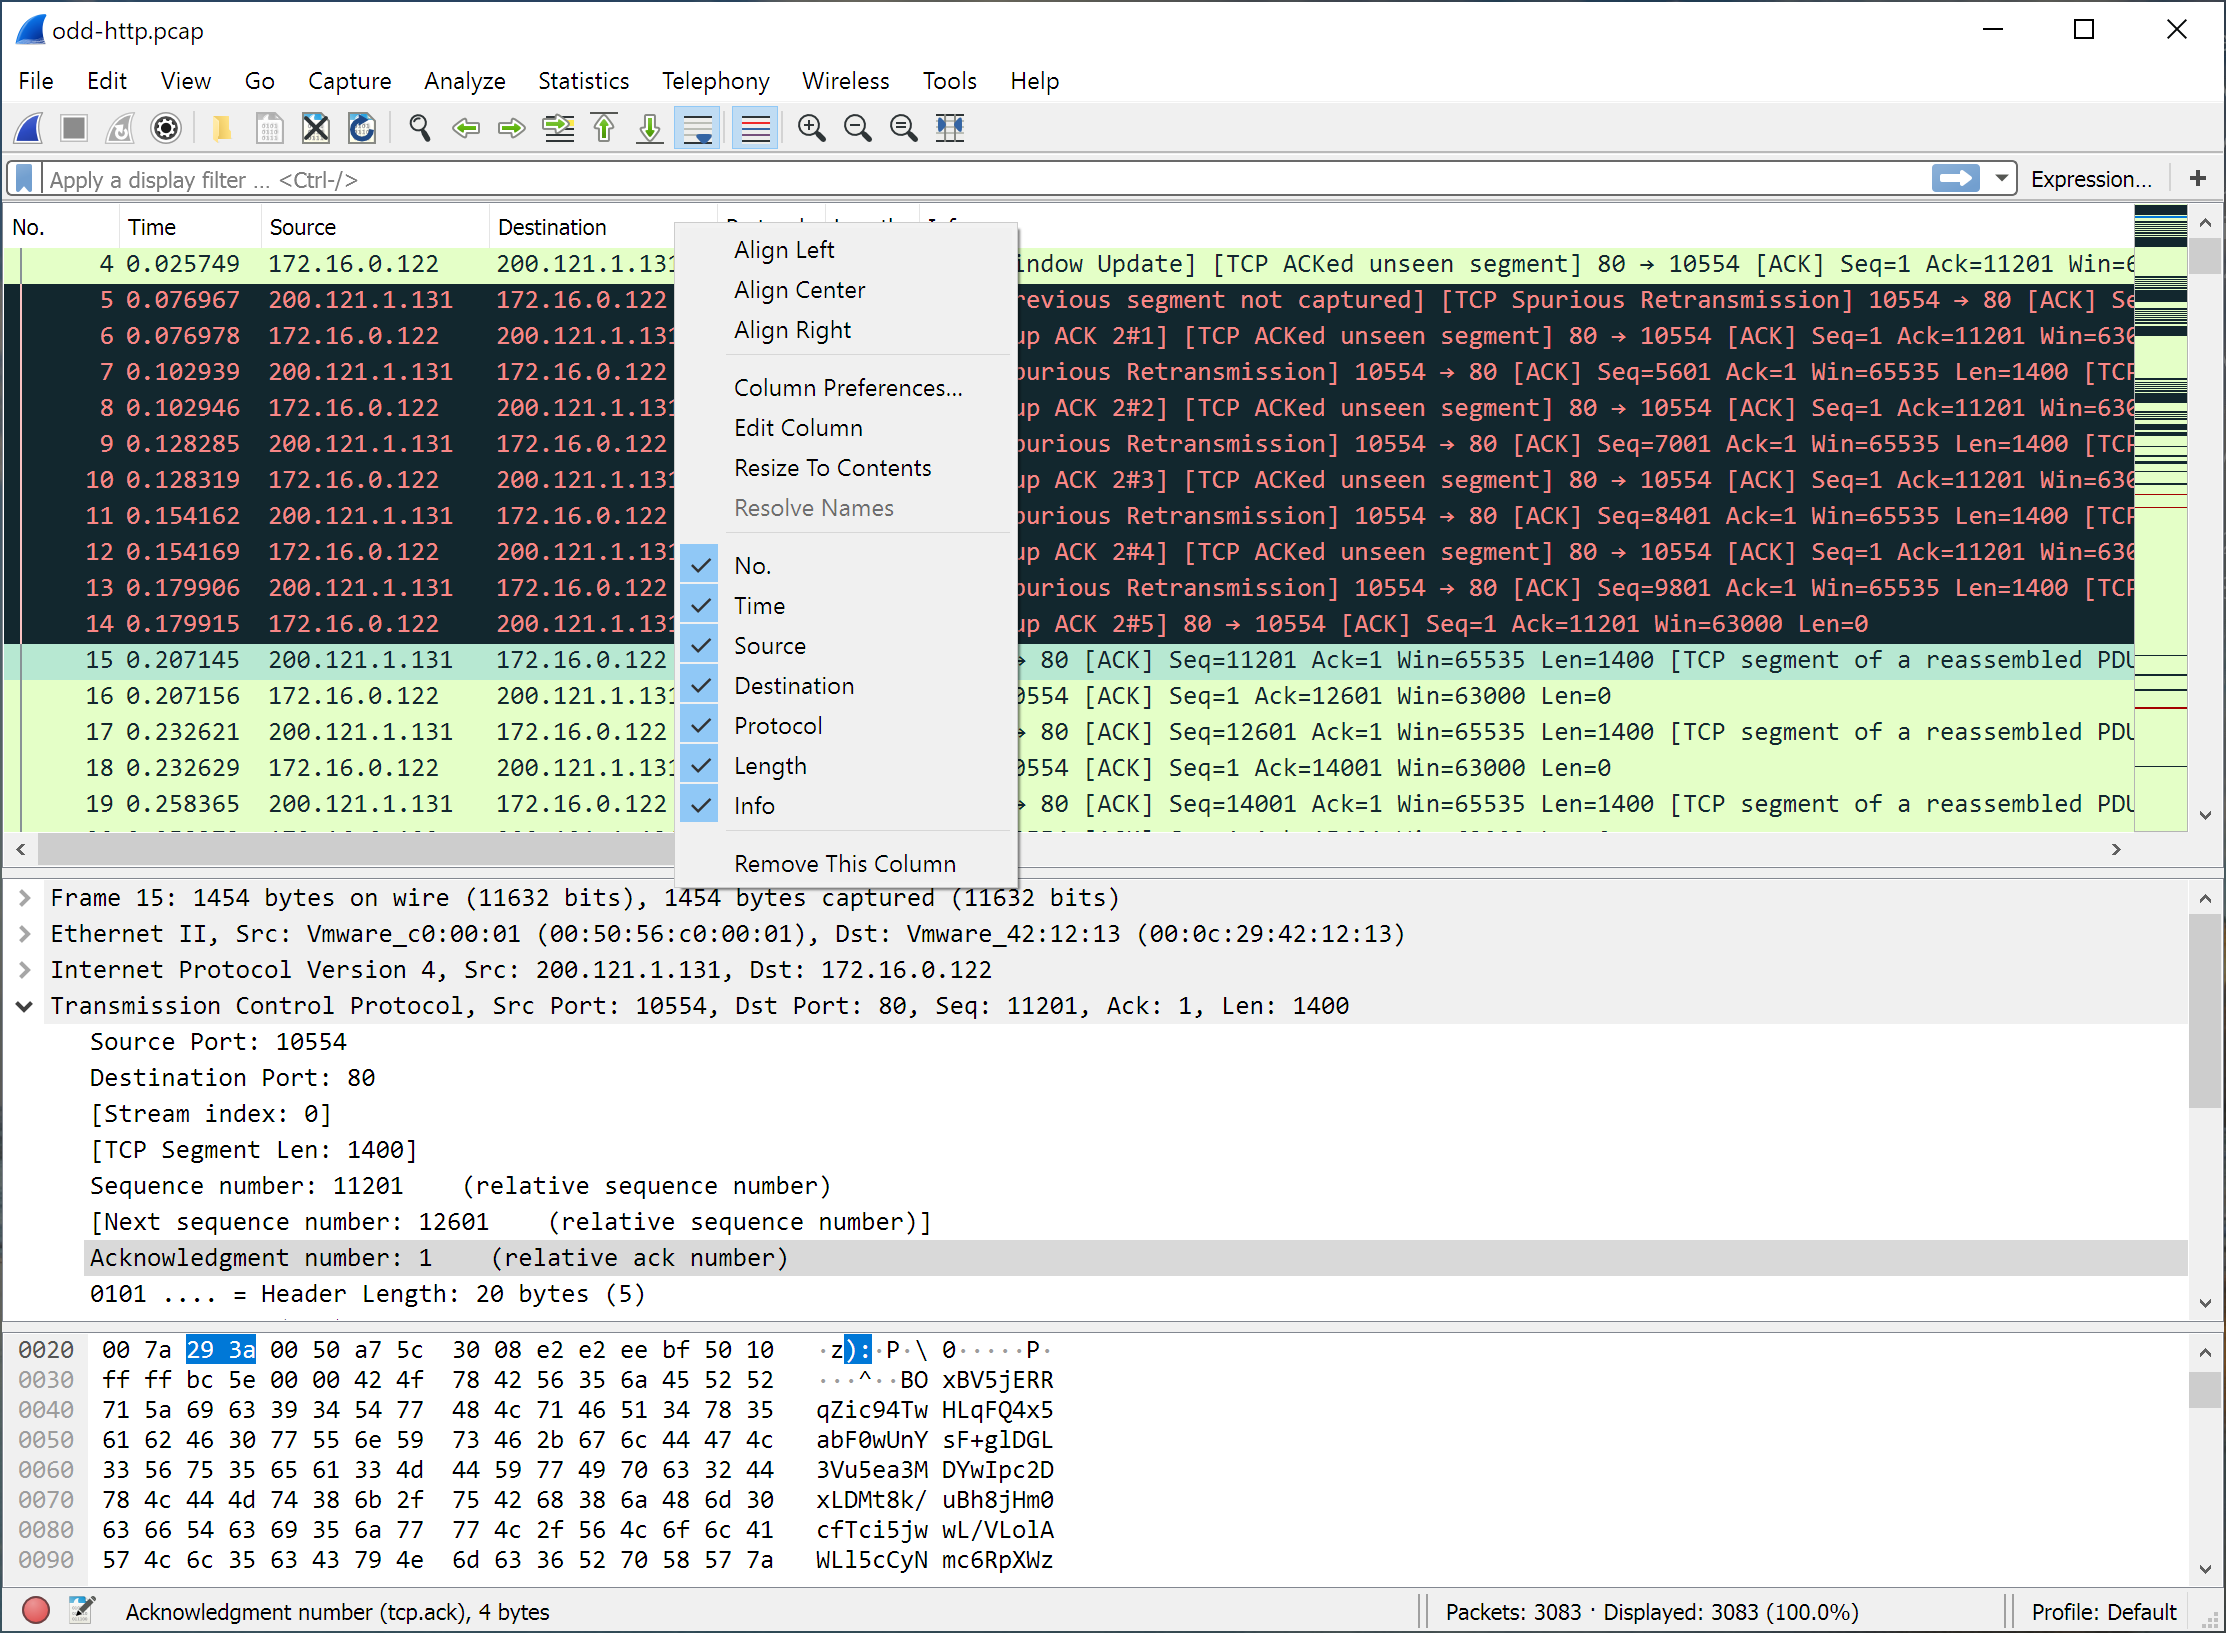
Wireshark offers three separate panes for viewing and analyzing packet data. The top pan is the Packet List, which lists all the packets in a capture. When a user clicks on a packet, the other panes display the packet’s details. They also show the user whether the packet is part of a conversation.

Here is an outline of the columns in the Packet List pane:
- —refers to the number of the packet, reflecting the order of capture. The bracket indicates that the packet is part of a conversation.
- Time—refers to the duration between the start of a capture and the packet being captured. Users can modify this value under Settings if they require a different number to be displayed.
- Source—displays the system address from which the packet was sent.
- Destination—displays the destination address for the packet.
- Protocol: This is the type of packet, for example, TCP, DNS, DHCPv6, or ARP.
- Length—refers to the packet’s length in bytes.
- Info—displays additional information about the contents of the packet. This information varies depending on the type of packet.
The second pane is Packet Details, which displays the most detailed, readable packet information, depending on the packet type. The highlighted text in this field enables users to create and right-click on filters.
The bottom pane is Packet Bytes, which displays the packet in hexadecimal, reflecting exactly how it was captured.
When viewing packets that are part of a conversation, users can right-click on the packets to select Follow, which will display only the packets that are part of the same conversation.
Filters
Wireshark offers several filters for various use cases. Users can select filters to view captures in various ways, enabling them to focus on specific issues for troubleshooting purposes. Important Wireshark features include the capture and display filters.
Capture filters determine which packets can be captured. If a packet doesn’t match the filter, Wireshark does not save it. Examples of capture filters include:
- host IP-address—limits captures to inbound and outbound traffic from the IP address.
- dst host IP-address—captures all packets sent to a specified host.
- net 192.168.0.0/24—captures all subnet traffic.
- port 53—limits captures to port 53 traffic.
- port not 53 and not arp—captures all traffic excluding ARP and DNS traffic.
Display filters determine the visualization of captures for analysis. After stopping a packet capture, users can narrow the display with these filters to focus on the packets relevant to the troubleshooting issue. Examples of display filters include:
- src==IP-address and ip.dst==IP-address—displays the packets sent from the ip.src computer to the ip.dst computer. Users can view packets to or from an IP by specifying ip.
- port eq 25—displays all the traffic on port 25 (typically SMTP traffic).
- Icmp—limits the display to ICMP traffic (usually, pings in the capture).
- addr != IP_address—displays all traffic excluding inbound or outbound traffic from a specified computer.
Conclusion
In this article, I explained the basics of Wireshark and showed the steps involved in performing forensic analysis of network data for security purposes:
- Install wireshark on the local device
- Review network packets and inspect packet details
- Define filters to capture relevant data
- Analyze the data to discover suspicious activity
I hope this will be useful as you expand your repertoire of digital forensics capabilities.