WhacAMole
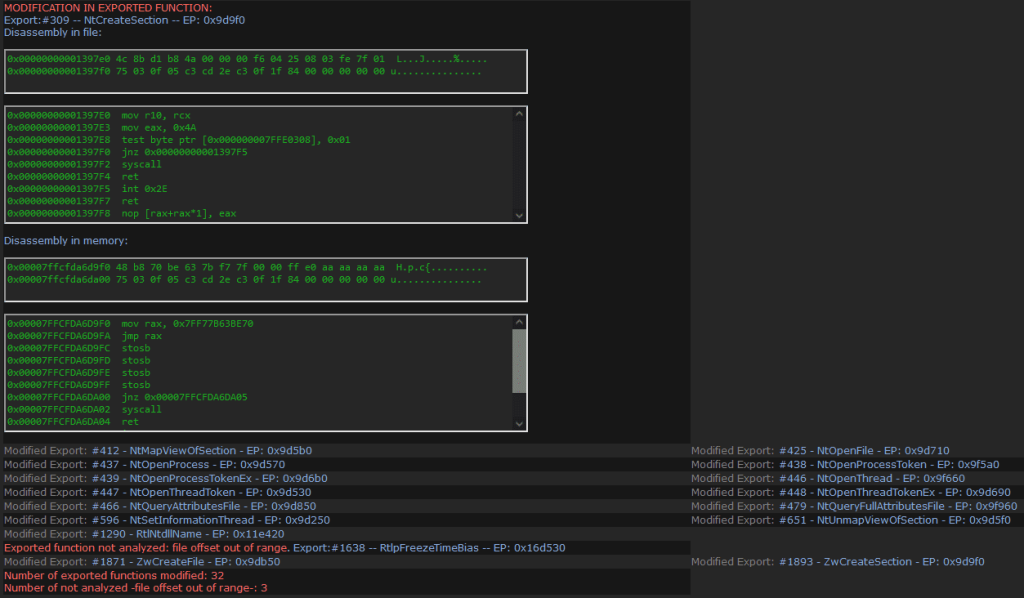
WhacAMole is a program that analyzes processes in memory in an integral way, detecting and alerting of anomalies related to the malware and presenting and saving in files all the relevant information for verification, correlation, or analysis, as well as dumping memory regions, processes, and suspicious modules. To achieve this, it analyzes not only the anomalies of the memory regions of the processes and the modules they load, but it also analyzes in depth all the memory space in use by the process. At this moment, WhacAMole is capable of identifying 67 alerts related to malicious behavior or that can only be due to malware. It shows more than 70 properties of the processes, memory, and modules, comparing many of their attributes read in memory with those that appear in the corresponding file on disk, partially disassembles suspicious memory regions, and partially disassembles exported functions that have been modified in memory for analysts to conduct their own investigations.
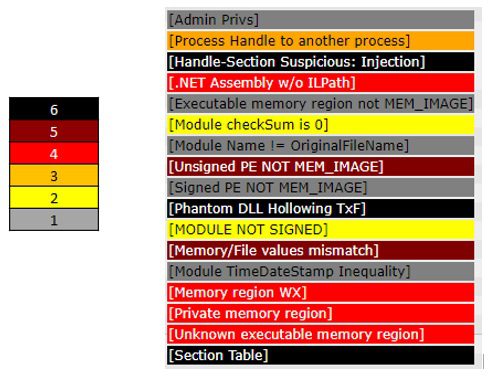
Unlike other similar programs, it makes all the relevant information on the processes available to analysts, labeling those characteristics that are related to malware with different alerts, so that they can carry out their own analysis or look for other signs of the existence of malicious processes. Alerts are classified, according to their danger and the number of processes in which the same behavior appears, according to a scale of six values, reflected in the html document with a color scale, with 6 (black color) being an indicator of the probability higher than that the detected characteristic is due to malware and 1 (gray color) that, although the behavior is abnormal, there are many system processes where the same behavior has been observed:
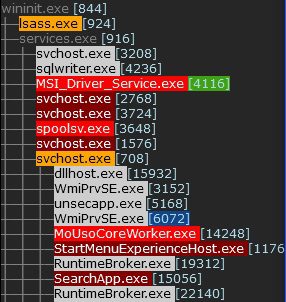
To facilitate the work of the analysts, the information is presented on screen, in an HTML file with a navigation panel of the processes analyzed, and in csv text files. In the side panel of the html document, the process tree is shown, with the color corresponding to the highest alert detected in them, with the hyperlink to its location in the document, and with the blue color in its PID if it is a 32 bits process or green if it is a .NET process.
At the bottom of the navigation panel of the html document, all the alerts are shown, with their color, with the PIDs of the processes in which they have been detected in the form of a hyperlink to the position of the document where the process is shown.
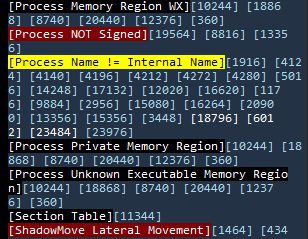
If there are no processes detected with an alert, their name is displayed on a white background.
Download
Copyright (c) 2022 Ignacio J. Perez Jimenez
