pwndbg
pwndbg (/poʊndbæg/) is a GDB plug-in that makes debugging with GDB suck less, with a focus on features needed by low-level software developers, hardware hackers, reverse-engineers and exploit developers.
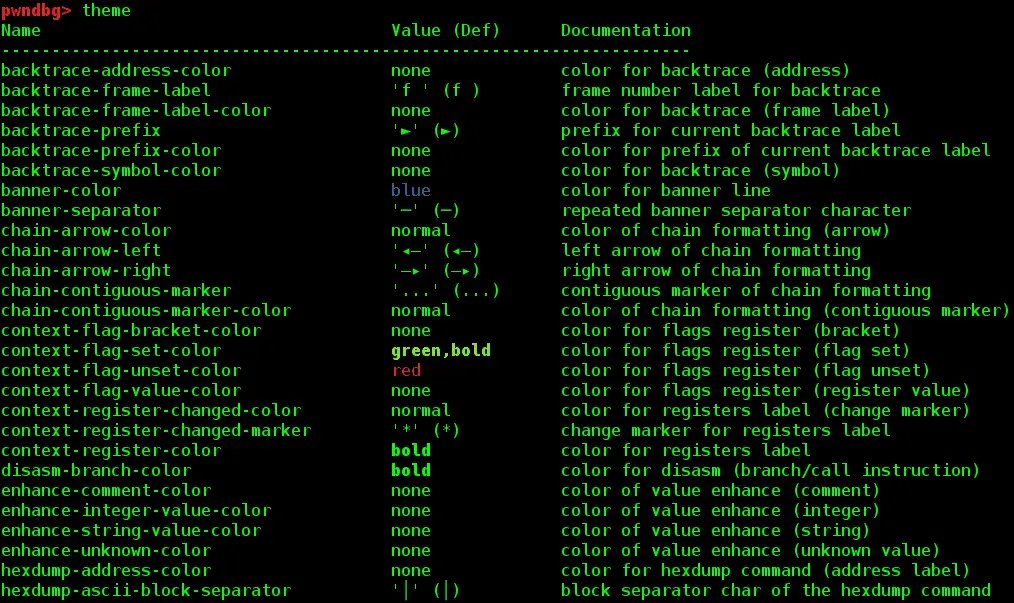
Pwndbg has a lot of useful features. You can a list of all available commands at any time by typing the pwndbgcommand. Here’s a small subset which is easy to capture in screenshots.
Arguments
All function call sites are annotated with the arguments to those functions. This works best with debugging symbols, but also works in the most common case where an imported function (e.g. libc function via GOT or PLT) is used.
Context
A useful summary of the current execution context is printed every time GDB stops (e.g. breakpoint or single-step), displaying all registers, the stack, call frames, disassembly, and additionally recursively dereferencing all pointers. All memory addresses are color-coded to the type of memory they represent.
Disassembly
Pwndbg uses Capstone Engine to display disassembled instructions, but also leverages its introspection into the instruction to extract memory targets and condition codes.
All absolute jumps are folded away, only displaying relevant instructions.
Additionally, if the current instruction is conditional, Pwndbg displays whether or not it is evaluated with a green check or a red X, and folds away instructions as necessary.
Emulation
Pwndbg leverages Unicorn Engine in order to only show instructions which will actually be emulated. At each debugger stop (e.g. breakpoint or single-step) the next few instructions are silently emulated, and only instructions which will actually be executed are displayed.
This is incredibly useful when stepping through jump tables, PLT entries, and even while ROPping!
Heap Inspection
Pwndbg enables introspection of the glibc allocator, ptmalloc2, via a handful of introspection functions.
IDA Pro Integration
Pwndbg flips traditional IDA Pro integration on its head. Rather than sticking code inside of IDA that you need to interact with, by installing a small XMLRPC server inside of IDA, Pwndbg has full access to everything IDA knows.
This allows extraction of comments, decompiled lines of source, breakpoints, and synchronized debugging (single-steps update the cursor in IDA).
More…
Installation
Copyright (c) 2023 Dominik ‘Disconnect3d’ Czarnota


