Install & Use Linux System Management Toolkit Sysstat
Sysstat is a software package that contains a set of tools for monitoring system performance and efficiency. These tools collect system performance data, such as CPU usage, hard disk, and network throughput data. This data collection and analysis helps us determine whether the system is normal operation, is a good assistant to improve system operation efficiency and safely run the server.
The sysstat package contains various utilities, common to many commercial Unixes, to monitor system performance and usage activity:
- iostat reports CPU statistics and input/output statistics for block devices and partitions.
- mpstat reports individual or combined processor related statistics.
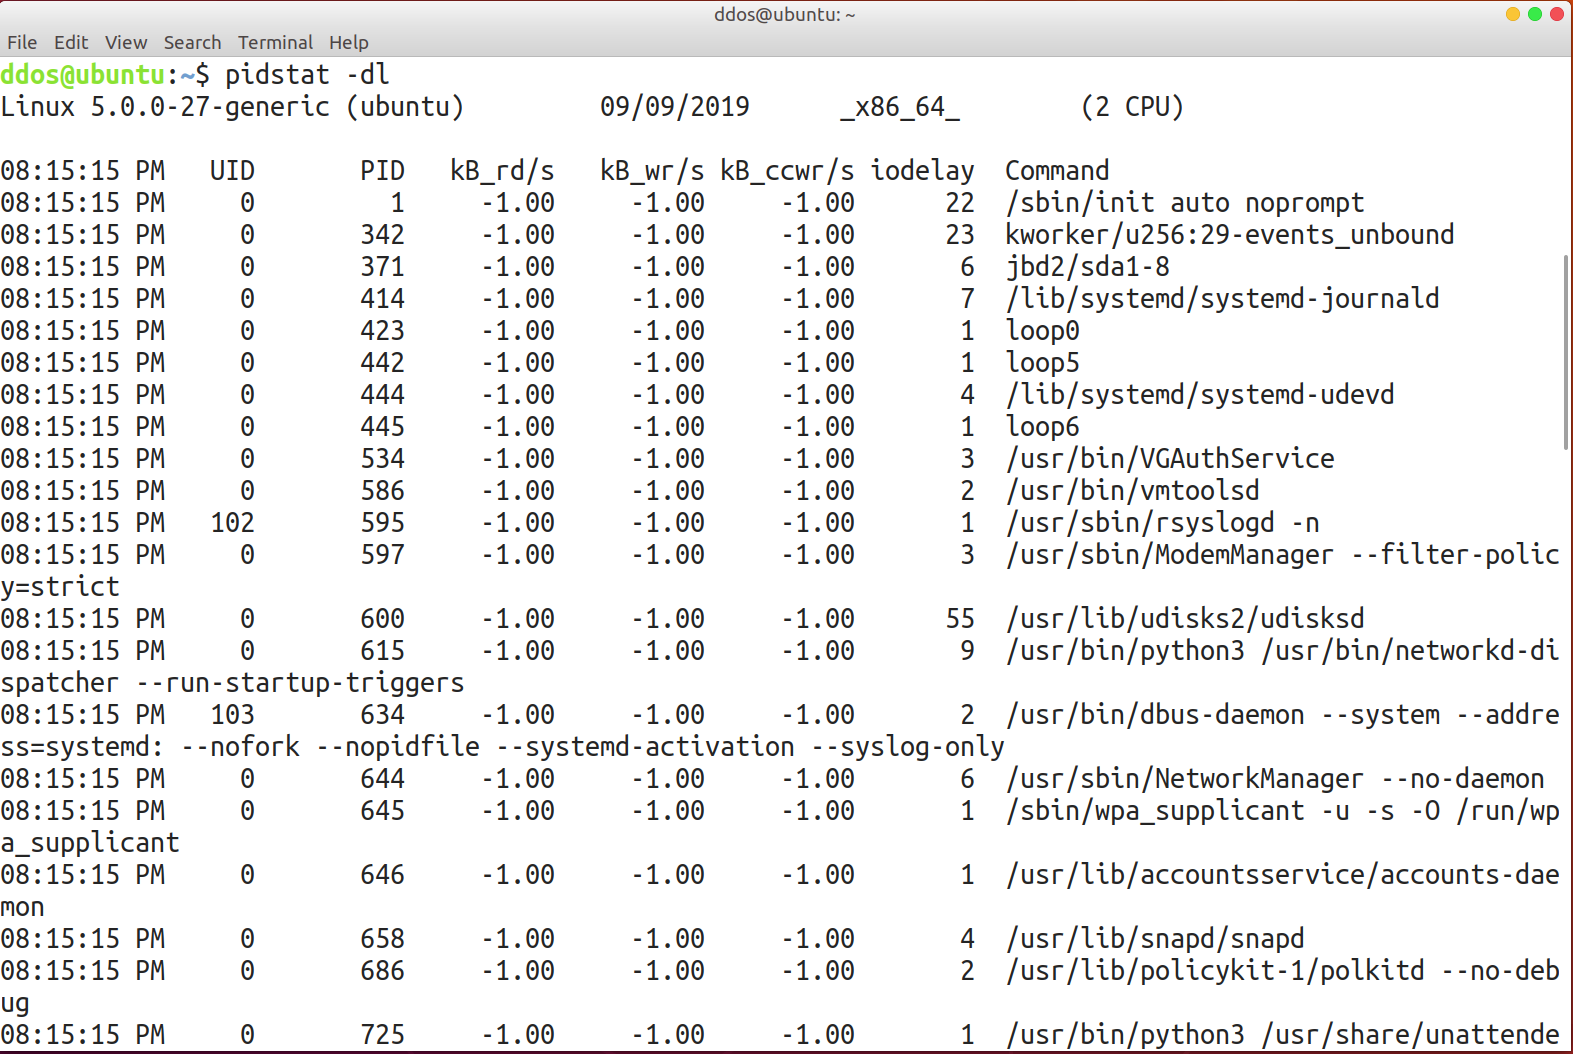
- pidstat reports statistics for Linux tasks (processes) : I/O, CPU, memory, etc.
- tapestat reports statistics for tape drives connected to the system.
- cifsiostat reports CIFS statistics.
Sysstat also contains tools you can schedule via cron or systemd to collect and historize performance and activity data:
- sar collects, reports and saves system activity information (see below a list of metrics collected by sar).
- sadc is the system activity data collector, used as a backend for sar.
- sa1 collects and stores binary data in the system activity daily data file. It is a front end to sadc designed to be run from cron or systemd.
- sa2 writes a summarized daily activity report. It is a front end to sar designed to be run from cron or systemd.
- sadf displays data collected by sar in multiple formats (CSV, XML, JSON, etc.) and can be used for data exchange with other programs. This command can also be used to draw graphs for the various activities collected by sar using SVG (Scalable Vector Graphics) format.
Installation of Sysstat performance monitoring tool in Linux
Currently, mainstream Linux systems have their own sysstat integration package.
On Ubuntu, simply install sysstat with the command:
sudo apt-get install sysstat
On the CentOS/Red Hat platform we can install it with the following commands:
yum -y install sysstat
You can install sysstat develop version with the command:
git clone git://github.com/sysstat/sysstat
cd sysstat
./configure
make &&make install
Use Sysstat
After the installation is complete, use the command to check whether the current version can be seen:
ddos@ubuntu:~$ sar -V
sysstat version 11.6.1
(C) Sebastien Godard (sysstat <at> orange.fr)
System statistics collected by sar:
- Input / Output and transfer rate statistics (global, per device, per partition and per network filesystem)
- CPU statistics (global and per CPU), including support for virtualization architectures
- Memory, hugepages and swap space utilization statistics
- Virtual memory, paging and fault statistics
- Process creation activity
- Interrupt statistics (global, per CPU and per interrupt, including potential APIC interrupt sources, hardware and software interrupts)
- Extensive network statistics: network interface activity (number of packets and kB received and transmitted per second, etc.) including failures from network devices; network traffic statistics for IP, TCP, ICMP and UDP protocols based on SNMPv2 standards; support for IPv6-related protocols
- Fibre Channel traffic statistics
- Software-based network processing (softnet) statistics
- NFS server and client activity
- Sockets statistics
- Run queue and system load statistics
- Kernel internal tables utilization statistics
- Swapping statistics
- TTY devices activity
- Power management statistics (instantaneous and average CPU clock frequency, fans speed, devices temperature, voltage inputs)
- USB devices plugged into the system
- Filesystems utilization (inodes and blocks)
The tools included in the sysstat toolkit:
- The iostat tool provides data on CPU usage and hard drive throughput;
- The mpstat tool provides a single processor or multiple processors related data;
- The pidstat: statistics about running processes/tasks, CPU, memory, etc.
- The sar tool is responsible for collecting, reporting, and storing system active information;
- The sa1 tool is responsible for collecting and storing daily system dynamics into a binary file. It is run by the scheduled task tool cron, which is a program front-end program designed for sadc;
- The sa2 tool is responsible for writing daily system activity into summative reports. It is a front end designed for sar, to be called by cron
- The sadc is a system dynamic data collection tool, the collected data is written in a binary file, which is used as the back end of the sar tool;
- The sadf displays data collected by sar in multiple formats;
- The nfsiostat: I/O statistics of NFS (Network File System).
- The cifsiostat: CIFS (Common Internet File System) statistics
1, iostat
iostat – Report Central Processing Unit (CPU) statistics and input/output statistics for devices and partitions.
iostat –help
Usage: iostat [ options ] [ <interval> [ <count> ] ]
Options are:
[ -c ] [ -d ] [ -h ] [ -k | -m ] [ -N ] [ -s ] [ -t ] [ -V ] [ -x ] [ -y ] [ -z ]
[ -j { ID | LABEL | PATH | UUID | … } ] [ –human ] [ -o JSON ]
[ [ -H ] -g <group_name> ] [ -p [ <device> [,…] | ALL ] ]
[ <device> […] | ALL ]-c : Display only the status of the cpu
-d : Display only the status of the storage device, can not be used with -c
-k: The default is to read the block information read and read, and use -k to change to KB size to display -m
-t : Display date
-p device | ALL : device is a device or a partition. If ALL is used, it means to display information about all partitions and devices.

2, mpstat
mpstat – Report processors related statistics.
mpstat –help
Usage: mpstat [ options ] [ <interval> [ <count> ] ]
Options are:
[ -A ] [ -n ] [ -u ] [ -V ] [ -I { SUM | CPU | SCPU | ALL } ]
[ -N { <node_list> | ALL } ] [ -o JSON ] [ -P { <cpu_list> | ON | ALL } ]
%user shows the percentage of total CPU time spent running at the user level (application).
%nice shows the percentage of total CPU time spent at the user level for the nice operation.
%system The percentage of total CPU time spent running at the kernel level (kernel).
%iowait shows the percentage of total CPU time spent waiting for I/O operations.
%irq shows the total CPU time occupied by the hard interrupt during the interval.
%soft displays the total CPU time occupied by the soft interrupt during the interval.
%steal The percentage of virtual CPUs that the hypervisor is servicing for another virtual process.
%idle Shows the percentage of CPU idle time that takes up total CPU time.
Intr/s The number of interrupts received by the CPU per second during the internal time period.

3, sadc
sadc – System activity data collector.
/usr/lib/sa/sadc [ -C comment ] [ -D ] [ -F ] [ -f ] [ -L ] [ -V ] [ -S { keyword [,…] | ALL | XALL [,…] } ] [ interval [ count ] ] [ outfile ]
4, sadf
sadf – Display data collected by sar in multiple formats.
ddos@ubuntu:~$ sadf –help
Usage: sadf [ options ] [ <interval> [ <count> ] ] [ <datafile> | -[0-9]+ ]
Options are:
[ -C ] [ -c | -d | -g | -j | -p | -r | -x ] [ -H ] [ -h ] [ -T | -t | -U ] [ -V ]
[ -O <opts> [,…] ] [ -P { <cpu> [,…] | ALL } ]
[ -s [ <hh:mm[:ss]> ] ] [ -e [ <hh:mm[:ss]> ] ]
[ — <sar_options> ]
5, sar
The sar tool is powerful. It can collect system CPU, hard disk, dynamic data, dynamic display, and binary data files. sar has many applications, and it is more complicated and more accurate.
ddos@ubuntu:~$ sar –help
Usage: sar [ options ] [ <interval> [ <count> ] ]
Options are:
[ -A ] [ -B ] [ -b ] [ -C ] [ -D ] [ -d ] [ -F [ MOUNT ] ] [ -H ] [ -h ]
[ -p ] [ -q ] [ -r [ ALL ] ] [ -S ] [ -t ] [ -u [ ALL ] ] [ -V ]
[ -v ] [ -W ] [ -w ] [ -y ] [ –human ] [ –sadc ]
[ -I { <int_list> | SUM | ALL } ] [ -P { <cpu_list> | ALL } ]
[ -m { <keyword> [,…] | ALL } ] [ -n { <keyword> [,…] | ALL } ]
[ -j { ID | LABEL | PATH | UUID | … } ]
[ -f [ <filename> ] | -o [ <filename> ] | -[0-9]+ ]
[ -i <interval> ] [ -s [ <hh:mm[:ss]> ] ] [ -e [ <hh:mm[:ss]> ] ]
-A displays all historical data by reading all the files in the /var/log/sar directory and displaying them in different categories;
-b reading the set throughput rate through the device’s I/O interrupt;
-B reporting memory Or virtual memory exchange statistics;
-c reports the number of processes created per second;
-d reports information such as writes and reads of physical block devices (storage devices), if intuitive, can be used with p parameters, -dp
-f Reads content from a binary data file, such as sar -f filename
-i interval specifies the time of data collection, the time unit is seconds;
-n analyzes the statistics of network device status, and the following parameters can be connected to DEV, EDEV , NFS, NFSD, SOCK, etc. For example, -n DEV
-o writes statistics to a file, such as -o filename ;
-P reports each processor application statistics for multiprocessor machines and enables the SMP kernel to be valid;
-p displays friendly device names, For easy viewing, it can also be combined with the -d and -n parameters, such as -dp or -np
-r memory and swap area occupancy statistics;
-R
-t This option is useful for reading data from a file, if not, Will read out as local time;
-u report parameters of CPU utilization;
-v report resource occupancy information of inode, file or other kernel table;
-w report information of system exchange activity; number of exchanged data per less;
-W report system exchange activity throughput information;

6, pidstat
pidstat – Report statistics for Linux tasks.
ddos@ubuntu:~$ pidstat –help
Usage: pidstat [ options ] [ <interval> [ <count> ] ] [ -e <program> <args> ]
Options are:
[ -d ] [ -H ] [ -h ] [ -I ] [ -l ] [ -R ] [ -r ] [ -s ] [ -t ] [ -U [ <username> ] ]
[ -u ] [ -V ] [ -v ] [ -w ] [ -C <command> ] [ -G <process_name> ] [ –human ]
[ -p { <pid> [,…] | SELF | ALL } ] [ -T { TASK | CHILD | ALL } ]
Support Our Threat Intelligence
If you find our technology report and cybersecurity news helpful, consider supporting our work.


