In fact, there is a physical test in each test of 3DMark. This test is actually running the CPU. We often run this physical test separately when testing the CPU. Now, 3DMark has launched a special test to run the CPU performance, CPU Profile.
The 3DMark CPU Profile test is different from traditional CPU test tools. It does not only test full-core or single-threaded performance. It has six tests. Each test uses a different number of threads. The tests include the maximum thread, 16 threads, 8 threads, 4-thread, dual-thread, and single-thread, each test will give an independent score.
At present, the number of CPU cores and the number of threads have grown rapidly, but the software has not kept up with this speed. Many applications cannot call so many threads. So 3DMark’s CPU Profile test only got six tests with different thread numbers.

According to their description, the application status of the largest thread rarely appears in the game, and most of it appears in extremely heavy multi-threaded workloads, such as movie quality rendering, simulation, and scientific analysis, etc. The scores of 16 threads have relatively little correlation with actual games. This is a load of computationally intensive applications such as digital content creation and 3D rendering. 8 threads are the typical load of DirectX 12 games now. CPU games are usually most related to 8-thread scores. The CPU test in 3DMark Time Spy is also 8-threaded. 4-thread and dual-thread are relatively common in old games developed on the basis of DirectX 9. The current popular e-sports games such as “Dota 2”, “League of Legends” and “Counter-Strike: Global Offensive” have to correlate most closely with the 2-threads and 4-threads scores. The 1-thread score is a fundamental measure of the processor’s performance. For games and real-world use cases, however, the multithreaded scores are usually a better indicator of practical performance.
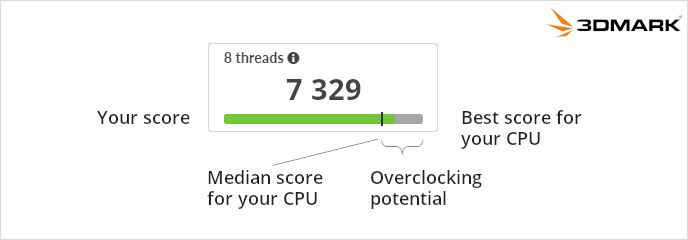
In addition, the software will compare your CPU score with other processors of the same model in the online database. The green bar on the test result graph is your running score, and the black line represents the median score of this processor. The black line to the right end of the bar graph indicates the overclocking potential of this processor. The right end is actually the highest score of this processor, and the gray area is actually the overclockable space of your processor. If your score is lower than the median, it means that there may be a problem with your heat dissipation or settings.
The CPU Profile test requires 3DMark Advanced or Professional Edition. Now, this test has been pushed to users who have these two versions for free, and you can update by yourself.